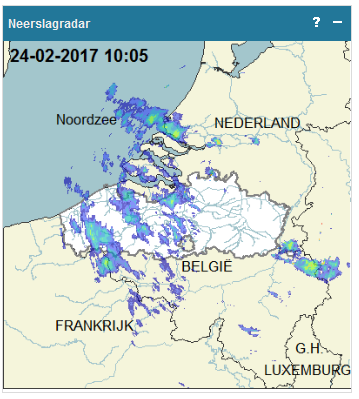
 In geval van overstroming speelt neerslag vaak de hoofdrol. Op overzichtelijke regenkaarten zie je waar het hoeveel regent. Op de centrale grote kaart worden de neerslagradartotalen van de voorbije 24 uur getoond.
Via de geanimeerde radarbeelden kan je de neerslag op de voet volgen. Elke 5 minuten wordt een nieuw neerslagradarbeeld gegenereerd en de beelden van het laatste anderhalf uur zijn raadpleegbaar via de animatie. Eenvoudige grafieken en kaarten voorspellen de neerslag voor de komende uren en dagen.
Je kan geregistreerde neerslag opvragen voor een punt en voor een stroomgebied; we spreken dan van puntneerslag en stroomgebiedsneerslag.
- Puntneerslag wordt geregistreerd door een pluviometer of regenmeter. Verspreid over heel Vlaanderen zijn tientallen pluviometers opgesteld, die elke 30 minuten nieuwe gegevens doorsturen.
- Stroomgebiedsneerslag wordt berekend op basis van radarbeelden, die worden aangeleverd door het KMI. Op basis van voorspelde radarbeelden kunnen we de stroomgebiedsneerslag voor de komende uren voorspellen. Voor de iets verdere toekomst maken we gebruik van weermodellen.
In de module tabel neerslag vind je een overzicht van de geregistreerde puntneerslag van de voorbije 24 en 48 uur voor de verschillende pluviometers. Je kan iedere kolom sorteren. Deze gegevens kan je ook op kaart of in grafiekvorm bekijken.
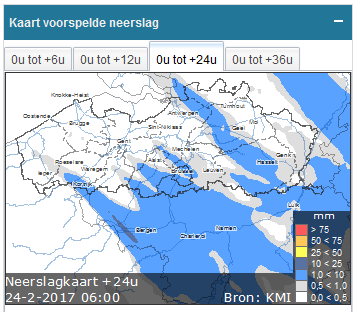 Ook voor de voorspelde toestand worden tabellen, grafieken en kaarten gemaakt. In de module kaart voorspelde neerslag zijn 4 tabbladen beschikbaar met cumulatieve neerslag tot 36 uur vooruit.
Lees meer...